1. In Power Point select a new page and select Insert > Add-In - Search for Power BI and select Power BI Tiles or Microsoft Power BI (to add report pages)
 |
| Insert Power BI Add-in |
2. Copy the url of the Power BI Report page and paste it in the box on the Power Point page and hit insert.
3. Once the Power BI account is done you can see the report page in your Power Point. This has all the functionality as in Power BI you can filter / slice the data in Power Point.
 |
| Play with your data in Power Point |
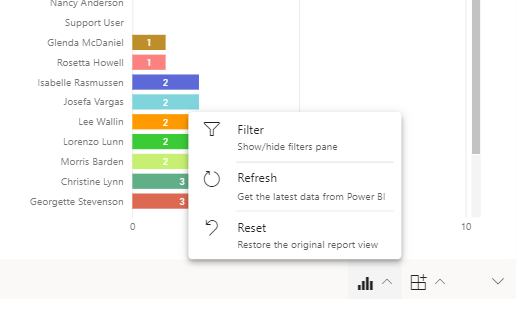
4. There is also a Power BI toolbar at the bottom which allows you to perform certain Power BI functions directly from Power Point. The Data Options from the toolbar is shown below -
5. Now if you want to share this power point with other users they need to also be shared the dataset and have the Power BI active account. The other option is to share it as an static image if the user does not need to play with the data.
Hope this gets you started with showing your Power BI reports and tiles in Power Point. Thanks for reading.
@mihircrm
365WithoutCode


