Showing posts with label #PowerBI. Show all posts

Monday, November 28, 2022

What's New in Power Platform - Process Mining

 This is a continuation of my blog series - What's new in Power Platform for the 2022 Release 2. This time the focus is on Process Mining using the Process Advisor. I will discuss here the need for a business process review and how a tool like process advisor can be useful for the organization. There are some paradigms to reflect upon,

"That's how we have always done it"

Organizations have been running business processes for ages on their ERP / CRM platform of choice. The processes may get modified over time and there may be "process debt" which is some old process that is still leftover in place because that was the way the system was set-up. In fact I have asked many clients why they do it in a certain way and the most common answer was "that's how we have always done it here!!"

"We are special" 

Another common answer to the question is "we are special" or "our business is unique". Every client is unique in the way they want to operate their business processes and that can create an ego issue when recommending solutions. I have worked with Clients who have changed their Systems three times but they refused to modify their business process. It is always the systems fault!!

"You cannot improve what you cannot measure"

I normally look for quantifiable data to prove to the client the benefits of a process change. When I ask the Client for any measurement on their business process KPI's they are looking at me as if I am from another planet. What's the point of implementing a system whose performance you cannot measure? How do you ensure the process is working or not? How do you plan to improve??

 That is where the Process Mining can help. It may be time to re-evaluate your current CRM / ERP processes. This will help in -

1. Setting a baseline - How are we doing today? How fast do we complete a Customer support case? What is our Lead to Opportunity conversion ratio?

2. Identify process bottlenecks - What is the longest stage / step in providing a Customer quote? Where does the Case gets stuck the most? How many variants of the process are there?

3. Automate - Identify what can be automated? Provide a business case for automation? How much can we decrease the Call Center agent time by automating certain steps? Do we really need to wait for an approval for all Cases? 

4. Re-evaluate your process - Is it required? obsolete? What are the competitors doing? What can we improve? Are we in compliance?

 Microsoft has recently announced the public preview of the Process Mining capabilities with Minit and Power Automate Process Advisor. 

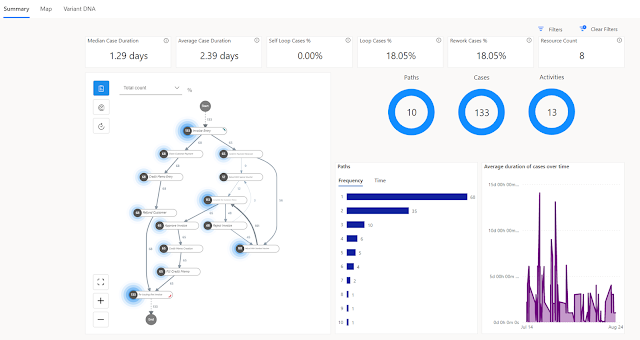
Process Mining - map and dashboard

Some of the new capabilities added to the Process Advisor are detailed here -  https://learn.microsoft.com/en-us/power-automate/process-mining-overview

Highlights -

  • Improved web experience 
  • New Minit Desktop App for deeper analytics 
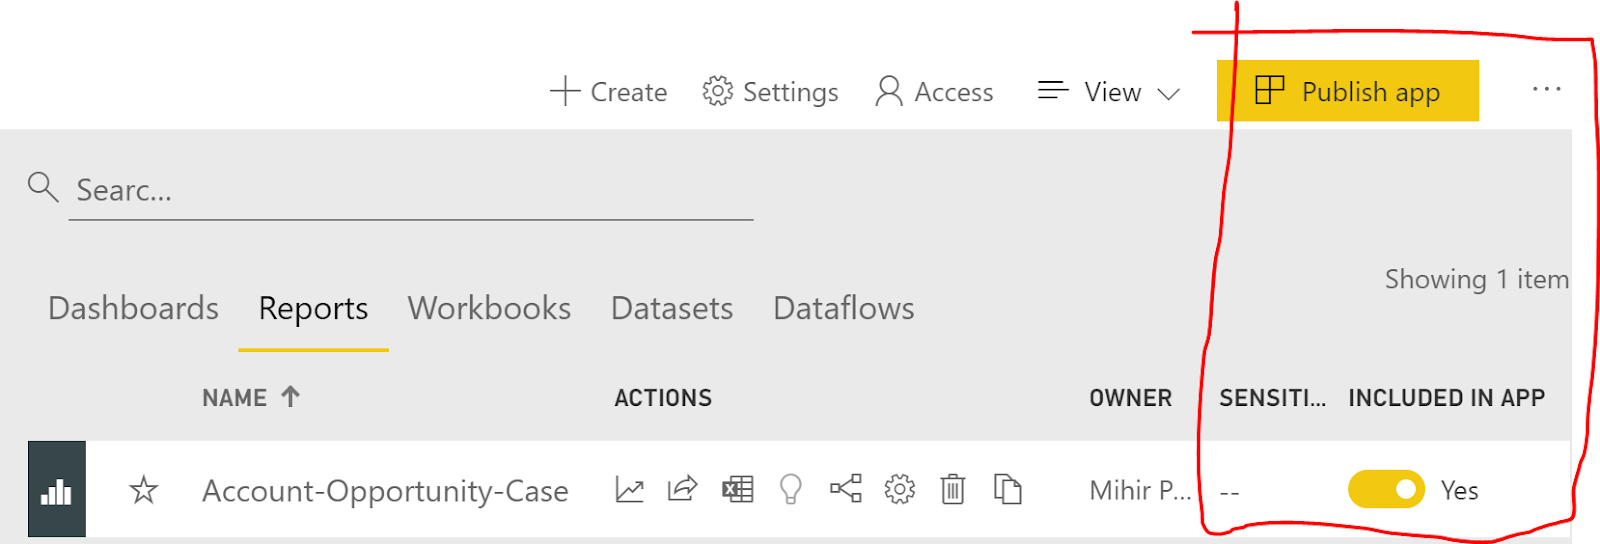
  • Customizable reporting using Power BI and new pre-built templates

In order to get all the benefits of Process Mining you may require multiple licenses that includes - Power Automate per user, Power BI premium, Microsoft Dataverse etc. If you already have all the required licenses why not try and make use of Process Mining today?

I will write more about the new Process Mining capabilities in my future blogs. Till then let me know what is your thoughts on Process Mining and how it can help to change your business processes. Thanks for reading.

@mihircrm 

365WithoutCode


Sunday, May 29, 2022

Let your data talk for you - Interactive Power BI in Power Point

One of the new feature released during the Microsoft Build 2022 session is to have interactive Power BI report pages (or tiles) in Power Point. This enables users to play with and better understand the story from the visuals in Power Point. Here is how easy it is using Microsoft 365 and Power BI - 

1. In Power Point select a new page and select Insert  >  Add-In  - Search for Power BI and select Power BI Tiles or Microsoft Power BI (to add report pages)

Insert Power BI Add-in

2. Copy the url of the Power BI Report page and paste it in the box on the Power Point page and hit insert.


3. Once the Power BI account is done you can see the report page in your Power Point. This has all the functionality as in Power BI you can filter / slice the data in Power Point. 

Play with your data in Power Point

4. There is also a Power BI toolbar at the bottom which allows you to perform certain Power BI functions directly from Power Point. The Data Options from the toolbar is shown below -

Data Options

Add Filters / Insights


5. Now if you want to share this power point with other users they need to also be shared the dataset and have the Power BI active account. The other option is to share it as an static image if the user does not need to play with the data.

Hope this gets you started with showing your Power BI reports and tiles in Power Point.  Thanks for reading.

@mihircrm
365WithoutCode


Thursday, March 31, 2022

AI and Power Platform Part-1 - AI with Power BI

 AI has become ubiquitously exploding and seems like every business application is now infused with it. This is also the case with many of the Microsoft business apps - Dynamics 365 and Power Platform. In this blog series I will explore the infusion of AI in the Microsoft Power Platform and business outcome benefits from it. To start this blog is about AI with(in) Power BI. 

There are many wonderful reasons to use Power BI -

1.    It is now the 'defacto' visualization tool for data with Microsoft

2.     Analytics using Power BI is easy to learn 

3.     It has built in AI capabilities that can be used without writing any code.

If you were not aware of the #3 above than now is the time to explore some of the AI capabilities. 

Power BI has many AI and AI related capabilities OOTB as detailed below -

1. Key Influencers - Provides impact and influence of key contributors on the result.

Key Influencers

The above report helps to answer Sales questions such as - What is the biggest influencer for an opportunity to be won? (or Lost) (discount as in this case and you may not need AI for that). The point is that we now have the power to quickly identify the key influencers on a particular business results. There is no more detailed modeling or manipulation of data needed and helps in understanding patterns and taking actions based on the key influencers.

2. Decomposition Tree - ability to quickly do a root cause and ad-hoc analysis using AI Splits.

Decomposition Tree

In this case we can drill down from Sales to a hierarchy of Sales by Category - by Product - by Region. The AI here is where to drill down using AI Splits to get to the next highest or lowest value. For example below shows that David So has the highest Opportunity values path.

AI Splits - Highest Opportunity value

This can be useful in identifying the biggest opportunity owner from an ocean of Sales data and making sure that the business results are met.
 

3. Anomaly detection - Auto detect anomalies in data and generate dynamic text summaries. Identifying anomalies in data may not be new but auto generating a paragraph that explains the anomaly can be very useful. It can also provide answers to specific questions. Lets look at the revenue line chart where there is a sharp decline in revenue. 


Anomaly detection

I can select the lowest point and right click > analyze > explain the decrease and Power BI shows me various possible reasons to identify the anomaly.

Analysis results

So now I know all the possible reasons there was a decrease in revenue in plain English. (If only it could tell me who is blank 😀 )

Additionally there are many other AI options like Q&A and Insights which provide great benefits to users.

You can add the AI insights to a report page using the Insert > AI visuals option or pick the AI visuals from the Visualizations pane.


I hope this helps in getting you started using AI in Power BI and let me know about your experience.

I will write more about AI in Power Platform in my future blogs. Thanks for reading.

@mihircrm

365WithoutCode


Monday, February 28, 2022

Industry Cloud solutions using Dynamics 365 and Power Platform

As Cloud applications are now the global standard, there is a demand for building vertical industry specific cloud solutions that provide pre-built insights and intelligence, business processes and relevant experiences for the industry. Microsoft has introduced multiple Industry Cloud with Dynamics 365 solutions. This blog is to introduce the Industry Clouds solutions from Microsoft built on the Microsoft Dynamics 365 and Microsoft Power Platform.

Currently there are 4 Industry Cloud solutions available and I am sure Microsoft is working on few more in the pipeline. They are as below.

  • Microsoft Cloud for Financial Services
  • Microsoft Cloud for Healthcare
  • Microsoft Cloud for Retail
  • Microsoft Cloud for Nonprofit

Each Industry Cloud has the following - 

1. Industry specific functionality - For example the Financial Services Cloud consists of the following -

A unified Customer Profile (Customer 360) app, Customer Onboarding app, Loan Management app  Customer Engagement app etc.. The Industry apps provide tailored experiences for both the users and Customers. They help in better collaboration and decision making.

Microsoft Cloud for Financial Services 


2.  Each Industry Cloud includes specific components - Solutions, Apps, Templates and Services. It also includes data model built for the Industry Cloud. The data model can also be installed as a stand alone solution. For example The Retail Banking data model.

3. A Compliance program for Microsoft Cloud which enables the Clients to measure and control Risks and manage Industry compliance. This also includes specific architectural templates to help in designing and deploying Microsoft Cloud solutions for the specific Industry. An example for Financial Services Cloud Architectural template is shown below.


There is certain requirements that needs to be followed.

1. You need to have the specific licenses before you can deploy the Industry Clouds. 

2. There are pre-requisite that needs to be completed and after the Industry Cloud solutions are deployed there are also post deployment steps to be followed. 

3. Pricing - Each industry Cloud has a specific pricing template. The price for Financial Services Industry Cloud is approx $20k per Tenant. If you have 1000+ users this is a very reasonable (imho) price for the OOTB functionalities that the Industry Cloud provides.

Pricing for Financial Services Cloud

I would recommend to first do an internal analysis on the business processes and perform a proof of concept testing of the Industry Cloud solution. 

The Microsoft Industry Cloud are great examples of how to best utilize Microsoft cloud apps for your specific Industry. They come pre-built with the data model, AI apps and solutions that you can easily test and deploy. I am certain this will help accelerate your cloud transformation journey. 

In my future blogs I will explore some of the Industry Clouds and write more about it. Thank you for reading and let me know about your experience with the Microsoft Industry Cloud.

@mihircrm

365WithoutCode


Wednesday, June 30, 2021

Measuring Customer Experience with Dynamics 365 Customer Voice

"What you cannot measure you cannot improve" - I think you will agree to this statement. If you want to improve your customer experience than first you need to know how to measure it. Once you measure it than you can track and take action from your insights to improve customer experience.

Customer Experience is about how the customer feels after having an interaction with your business. The interaction can be of 3 main types
1. Products - You want to know how the customer feels after purchasing and using your product. 
2. Services - If you are selling services, how the customer felt after the service was delivered. Like automotive maintenance service
3. Processes -  How was the customer online buying process experience or experience with the case resolution process.

An enterprise may want to know all 3 of the above and get valuable feedback from the Customer. If you have large number of products and thousands of customers globally you need to have a Enterprise Feedback management system like Dynamics 365 #CustomerVoice. 

I have written 2 blogs earlier about Microsoft Dynamics 365 - Customer Voice. My blog-1 gives an overview about Customer Voice and blog-2 is about considerations when deploying #CustomerVoice.
This blog is about how to measure your Enterprise Customer Experience using #CustomerVoice.

Measuring of Customer Experience is done using Satisfaction Metrics. The metrics are mapped to questions in the Survey. As the survey responses come in Customer Voice services sends the responses to Azure Cognitive services for analysis and also to the Customer Voice analytics engine. After the analysis is done the results are stores in Dataverse. 
Response analysis

There are 4 types of Satisfaction metrics that you can use. 
Satisfaction metrics


1. CSAT or Customer satisfaction is measured by responses to rating type questions in survey and is normalized to a range of 1-5. The below are example of CSAT survey questions.
CSAT question types


2. NPS or Net Promote Score is a metric used to measure customer loyalty. It is based on NPS type questions with scale 0-10 as shown below. 
NPS questions

Customer voice will group the respondents as follows 
    i.   Detractors = response from 0-6 rating
    ii.  Passive = responses with 7 or 8 rating
    iii.  Promotes = responses with 9 or 10 rating 
The NPS is a number calculated using the formula 
NPS = (% of Promoters) - (% of Detractors) 
NPS can range from -100 (100% detractors) to 100 (100% Promoters).

3. Sentiment - this identifies how the customer feels about a product, service or process. This is done using a text based question response. Sentiment will group the response based on the text as positive, negative or neutral. 

4. Custom Score - You may want to have a custom scoring of the question in a Survey. The custom score allows you to assign a point value to the answer options. Based on the response the score is calculated and assigned to the Survey.  This can help you to add more weightage to certain question answers and thus get an custom measurement of the respondents satisfaction level.

Custom Score

As you are planning and designing the questionnaire make sure that you understand how the customer experience can be measured so you have the right insights. In my next blog I will discuss about tracking and actionable insights.

I hope this helps you in improving your enterprise customer experience with #CustomerVoice. Thanks for reading.

@mihircrm
365WithoutCode

Friday, May 28, 2021

Teams and Power BI - Enable visual collaboration

 The integration of Power BI with Microsoft Teams has enabled enterprise wide collaboration on data and visual presentations. This brings new ways of generating team insights where remote teams can review the data and provide feedback to improve the visuals. 

Power BI and Teams - Visual collaboration 

There are multiple ways you can share the Reports and Visuals from Power BI service into a Teams Chat or Channel. This blog describes some of the options for using Power BI within Teams.

1. Power BI App in Teams - You can add the Power BI app to teams which will enable directly working in the Power BI Service from within Teams itself. 

Power BI app in Teams

2. You can also add a Power BI tab to a Teams Channel. This enables to collaborate on the Power BI report within the channel. 

Power BI - Add as a tab to Teams Channel

Note - When selecting to add a tab - you can only add a Power BI Report but not a dashboard to the channel.

3. Chat in Teams - You can chat in teams from a Power BI Report / Dashboard or even a visual. This inserts a link in teams chat for the shared content. 


Visual tile - Chat in Teams

4. Link preview - You can add a link to a Power BI - Report / Dashboard or App in Teams chat and a link preview is shown. The user can open the Power BI visualization from within Teams.

Link preview in Teams

Things to note -

1. In order for the Teams integration with Power BI - the users will need a Power BI Pro or Premium per user license or the Power BI Report is in a Power BI - Premium capacity. 

2. Users within the Team will need to be shared the reports and given access to the underlying dataset to enable them access to the content. One way to enable this is to share access to the Report workspace to the Microsoft 365 Teams group 
Microsoft 365 group access to Power BI workspace


3. Power BI dashboard cannot be added as a tab to Team channels. Also the Link preview does not work in Meeting Chat or Private Channels

4. Make sure that the Power BI Teams integration is enabled in the Admin Portal > Tenant settings. (by default it is enabled)
Teams integration is enabled

I hope that this helps you in integrating Power BI and collaborating within Microsoft Teams. Let me know how you have gained from the Team insights which are enabled with this new feature.

Thanks for reading

@mihircrm
365withoutCode


Tuesday, March 23, 2021

Power BI with Power Apps Portals - Part-3

 Portals are now becoming ubiquitous as a Customer / Partner / Employee engagement channel. They can provide valuable information to a large audience. There is a need to embed dynamic visualizations, dashboard and reports in a Portal. This is very much possible now using Power Apps and this blog discusses how visuals from Power BI can be embedded into Power Apps Portals.

In my earlier blog I had mentioned about getting started with Power BI and Dynamics 365 Power BI template apps. This is a continuation and Part-3 of the Power BI with Dataverse series of blogs. 

An embedded Power BI dashboard can provide valuable information to the user when logged into the Power Apps Portal. Its great that one can create powerful visualizations but when the visuals drive insights and is showcased to a large # of users the value of the visual increases exponentially for the organization.

Power BI embedded in Power Apps Portals

Assuming you have a Power BI report or dashboard ready and a Power Apps Portal created in the same environment. The following steps will help you embed a Power BI report in Power Apps Portals. 

1. Configure Power Apps Portal

Go to Power Platform Admin Center and select your Portal 

Enable Power BI visuals

Click on Manage Power BI embedded service and select the workspaces that you have the Power BI reports and dashboards to be shown on the Portal.

Select Workspaces

Now you have configured the Portal for embedding Power BI. While you are on the managing Portal select Portal Details copy the application ID of the Portal. It will be useful in the next step.

Portal App ID

2. Set up Azure AD security group

We will need a Azure security group with the CRM Portal as a member. This security group will be given access to Power BI API. This will enable the display of visuals in the Portal.

Log in to Azure and create a new Security Group in Azure Active Directory. 

Security Group
Add Microsoft CRM Portal as member of the security group. Apply the Portal application ID to the member. 
Add member
Add the above security group to the Power BI Tenant Developer settings as shown below. This will allow the Portal to use Power BI API.
Allow to user Power BI API

Now we have completed most of the setup required. Next step is to configure the Portal and add the Power BI report and or dashboard to the Portal.

3. Embed Power BI visual in the Portal

Go to make.powerapps.com and select your portal and click on edit. This will open the Power Apps Portal Studio.
Here you can select to add a new page to the Portal or add a section to an existing page to display the Power BI visual.
One of the components you can add to a page or section is Power BI.
Add Power BI component

Once the component is added you will get the options to select the Workspace > Dashboard or Report to add to the Portal.
Add Power BI visuals as component

Things to note -
1. Users who log in to the Portal will need to be authenticated using AAD. 
2. Users will need Power BI license to view the visual
3. The Power BI dashboard or report will need to be shared with the user

I hope the above was helpful in embedding Power BI visualizations in to your Power Apps portals. Let me know if you have embedded Power BI in your Portal or custom websites.

Thank you

@mihircrm
365WithoutCode


Friday, February 12, 2021

Power BI Template Apps - Power BI with Dataverse (D365) Part-2

 In my earlier blog I had written about connecting with PowerBI and Dataverse (D365) using the CDS or Dataverse connector. You can also use the Power BI template Apps that Microsoft has provided to see your Sales or Service data in PowerBI.com

As always there are pre-requisites for using the Apps. They are - 1. You need to have a Power BI - Pro license for all users who want to consume the app and also 2. Admin access to install the App and connect to D365.

So now that we have the requisite license and access let us install the template app. There are 3 D365 - Power BI template apps. They are shown below with demo data

1. Sales Analytics. https://tinyurl.com/88g43r2m


Sales Analytics Power BI App

2. Process Analytics: https://tinyurl.com/5ybgdqze

Process Analytics App

(I am not a fan of the background bluish color but that can be removed using PBI desktop as I have mentioned below)

3. Customer Service Analytics: https://tinyurl.com/3a2v2pmg

For this demo I was unable to get the demo data loaded in the app or connect the app to D365. This is from the Appstore -

Customer Service Analytics Power BI

I will write about the Sales Analytics App below -

1. Install - Go to https://tinyurl.com/88g43r2m  and click on Get it now (or in PowerBI.com go to Get Data and search for Sales Analytics app)

2. Once the app is installed you will see the App in PowerBI.com You will be able to see the App with demo data. You can also connect the App to your specific D365 / Dataverse instance. Once connected the D365 instance data will load into PowerBI.com

You get the below different reports in Sales Analytics App. 


3. You can than analyze the data in PowerBI or you can import the dashboard into D365. (I will write more about this in my later blogs)

4. The OOTB app does not have any custom tables and you will need to customize the App. This is now possible by downloading the Power BI report and importing the PBIX file into Power BI desktop.  Use the link below for downloading the Sales Analytics or Process Analytics Power BI report PBIX file.     

        https://tinyurl.com/1royw6my

5. Now you can add the custom tables and columns to the Power BI reports and create your own App.

I believe that the template apps are a very good starting point to use Power BI with Dataverse. Let me know if you have any questions or any other ideas of using Power BI with Dataverse / D365. 

Thanks for reading

@mihircrm / 365withoutcode

Sunday, January 31, 2021

Getting started using Power BI with Dataverse (D365) - Part-1

Power BI has become one of the top data visualization tools. In every project that I have worked on, the default option to visualize, analyze and reporting tool with Microsoft Dynamics 365 is Power BI. It is a natural out of the box fit and Microsoft is doing its best to make the default choice with Dataverse. 

I have written earlier about D365 and Power BI but in the journey of evolution,  the Power Platform has very much changed and it is time to have a fresh look.  In this blog series we will ponder over the ways to -

1. Connect Power BI with Dataverse (D365) - This blog #1

2. Perform D365 data transformations & generate valuable AI insights in Power BI

3. Create and import data visualizations in Power Platform from Power BI

4. Limitations and things to consider (like security) when using Dataverse and Power BI

PBI dashboard with D365

Pre-requisite - In order to get started with Power BI you will need the following -

1. A D365 / Dataverse environment - You can get a trail of Dynamics 365 using trials.dynamics.com

2. Power BI (free or paid) license - PowerBI.com

3. Power BI desktop (download free from PowerBI.com)

Once you have done the above we are ready to play with D365 and Power BI

A - Setup needed - For this blog series we will need the capability of adding Power BI visuals into D365 (dashboards and visuals) as well as enable the TDS (Tabular Data Stream) endpoint. This is done by going to admin.powerplatform.microsoft.com and select your D365 environment (tip - its not the default one). Environment > Settings > Product > Features and enable the 2 highlighted below


B - Connecting Power BI with Dataverse (D365)

1. Once you have the above and downloaded the Power BI desktop latest version (note the version changes ever month) you can click on > Get Data. 

This will open up a myriad of options (enough to baffle you and maybe you feel like in a candy store), but lets focus on the Power Platform for now. Select Power Platform and you have 2 main options (dataflows is not the topic of my current blog, maybe in the future) 

Connect options

Dataverse connector is the latest one offered (I am going to use it for this blog) The limitation here is that the size of the dataset is limited to 80MB. If your needs are more than 80 MB (which is quite obvious when using large datasets) use the CDS legacy connector. I am hoping that the Dataverse connector allows larger datasets in the near future. 

Once you click on connect with Dataverse. it will ask you if you want to import data or do a Direct Query. For this blog I am going to import the data into Power BI. At this time it is important to note that there is an important security difference between importing data into Power BI and using Data query. I will revisit this in my next blog.

Connectivity mode


Another thing that you will need to enter is the environment domain. It used to be simply coping your D365 domain url but Microsoft has made it a little complex. Now you are supposed to enter the url without https:// and remove the / in the end (had to do this twice just to get it right) If you don't know what is your environment domain url Go to Make.powerapps.com select your environment (not default) and click on Settings > Session details. 


Instance url

Once you have the details and click 'ok' you may be prompted to sign in (if you are not already signed in) and then shown the Navigator window to chose from the tables to import into Power BI. 
Select Table

Once you select a table make sure to select 'Transform Data' which will open up the Power Query Editor 
Select columns to import
Here click on Manage Columns and you will be able to select which columns you want to import. It is important to know the Dataverse data model to be able to understand what columns you will need to create your visualizations.

Once you have selected the columns click on Apply and this will start the import process. In my next blog we will look at the options for working with D365 data in Power BI. 

Hope this helps you to get started with using Power BI with Dataverse (D365). Thanks for reading.

@mihircrm
365WithoutCode


Friday, June 12, 2020

Collaborating with Power BI

Power BI helps you to enhance the value of your data. This value is multiplied when you are able to collaborate with others - by publishing, sharing and embedding or integrating your reports on website, portals and in mobile apps. Here are some of the ways to collaborate with Power BI.

Before we discuss collaboration I want to get the licensing clear. In most cases you will need a Power BI pro or premium license to share with others and for others to view your shared report. (There really is no free lunch with Microsoft). The only time you can get users to see the Power BI report without requiring a license is by publishing your report to a public website

1. Embedding of Power BI report - You can embed in the following applications and collaborating with other users -

a. Embed in SharePoint online
b. Embed in Microsoft teams
c. Embed in Portals
d. Embed in a website
e. Embed in Power App

Embed in Power BI


2. Sharing in PowerBI service - You can share your reports and dashboards in Power BI in a workspace or by creating an App. Workspace is preferred for a small group of team members with whom you want to interact to build the report / dashboard. Once you are ready you can create and publish an App to share with the larger audience or for the whole organization. The users can than interact with the report and dashboard.
You can also share the data set with other users who you trust and they can build copies of the report based on the data. 

Publish app from a workspace


3. Publish to a website - You can use the Publish to a (public) website option to share your report with anyone on the internet. Anyone who get to the public website can interact with the PowerBI report and be able to view / share it on social media etc without needing a license. The data refresh can happen approx every 2 hours or more.  Obviously if your data is sensitive you may not want to share on the public web.


4. Integration - You can also integrate Power BI with Power Automate so you can trigger a flow based on the data triggered in Power BI. Isn't that amazing.

Limitations of the above -
I think it is important to know the limitations of embedding Power BI specifically in Website / Portal and I am mentioning some here.

1. Azure B2B is not supported - So if you have external guest users who login to the Portal / Website they may not see the Power BI report.
2. Users will need Power BI license or you will need a Power BI premium license (mentioned earlier)
3. Power BI supports the following browsers and performance may vary
4. Users may have to login to access Power BI report


I will write more about the Power BI and Power Apps integration. Let me know your thoughts on above and if you are using any of the above features in your apps.
Thanks for reading.

@MihirCRM
365WithoutCode